Academic
Performance Series
Management of
Academic
Progress
Phone 904 724 3527 • Fax 904 725 2162
www.ads2010.com
MAP
Table of Contents
MAP Manual –
Managing Academic Progress Program
AIDE –
Academic Interpretation and Data Evaluation System
Instant
Identification of Safety Net Students
Curriculum and
Instructional Investigatory Tools
How Can I Use
MAP data to find Curriculum and Instructional Gaps?
Curriculum and
Instruction Questions
SSR Content
Scores, Courses and Students
NRT Reading
Content Scores, Courses and Students
SSM Content
Scores, Courses and Students
NRT Math
Content Scores, Courses and Students
Reading
Benchmarks by Courses and Students
Math
Benchmarks by Courses and Students
Menu 11 - FCAT
Gains and Losses
FCAT SSR
Reading Gains/Loses A+
FCAT SSR
Reading Gains/Loses NCLB
FCAT SSM Math
Gains/Loses NCLB
FCAT SSR
Reading Content Scores A+
FCAT SSR
Reading Content Scores NCLB
FCAT NRT
Reading Content Scores
FCAT SSM Math
Content Scores A+
FCAT SSR Math
Content Scores NCLB
FCAT SSR
Reading Content Scores Safety Net – Students
FCAT SSR
Reading Content Scores Safety Net - C and I
FCAT SSM Math
Content Scores Safety Net – Students
FCAT SSM Math
Content Scores Safety Net - C and I
MAP Overview
Vision Statement
Managing Academic Progress (MAP) is an organized methodology
designed to increase student achievement in the Florida Public School
System. Educators, parents and students
are empowered by the information necessary and the process to maximize student
potential. Through this process a school
receives the tools to improve its grade under the Florida A+ Accountability
System and meet Annual Yearly Progress (AYP) under the No Child Left Behind
Act (NCLB).
Goal
The goal of the MAP program is to increase student
achievement as measured by the Florida
Comprehensive Assessment Test (FCAT).
Method
The MAP program takes a holistic approach to the instructional process at a school and provides a year long program of administrative and instructional actions to be performed by administrators, instructors, students and parents.
The MAP program consists of seven separate elements that are interrelated to provide an overall approach to the instructional process: MAP Manual, MAP Task, MAP Profile, MAP Corridor, AIDE, MAP Training Program 1, and MAP Training Program 2.
MAP Manual – Managing Academic
Progress Program
The MAP program is a year long program based on the instructional cycle of a school. The MAP time line calls for a series of actions to be performed by the principal, administrative staff, guidance staff, teachers, and students. The MAP program provides the necessary processes and procedures to perform these actions.
MAP Task
A MAP Task is an administrative or instructional action. Each task has the following elements:
Task – The action to be performed
Step – Sequence and or order of actions
Cycle – Indicator of
when the task is to be performed
Pre-School – Prior to the beginning of school, typically in the summer time
Pre-Plan – Begins the first day teachers return and continues to approximately the tenth instructional day
Instructional – Each 45 day instructional Cycle
Summative – End of the school year
The MAP Time Cycle adapts to non-traditional school
timelines such as block schedules and year round schools.
Component– Instructional category of the task
Accountability
Curriculum and Instruction
Safety Nets
Scheduling
What it provides – Indicates the result of the task
What it is used for – Indicates the use of the task
Task Report – Provides the necessary information for the task
Interactive Analysis Option – Provides the appropriate analytical tool
Educational Recommendations – Administrative and instructional suggestions appropriate to the task.
MAP Profile
The MAP Profile is an administrative or guidance tool maintained at the school level documenting the school’s movement through the MAP Program.
MAP Corridor
The MAP Corridor interfaces the MAP Program with the
Academic Interpretation and Data Evaluation System (AIDE). This innovative concept
negates the need for extensive AIDE training and allows educators to
concentrate on the business of improving academic performance.
AIDE – Academic
Interpretation and Data Evaluation System
The AIDE system is a data analysis tool designed to provide everyone in the instructional chain from superintendent to the student, including the parents, the information necessary to increase student achievement.
MAP Training Program 1
The MAP Training Program 1 is designed for a select group of educators and provides in-depth training in the use of the program.
MAP Training Program 2
The MAP Training Program 2 is designed for all instructional and administrative users.
MAP Conceptual Model
The MAP Program is designed to provide schools and school systems with a process to increase student achievement. The foundation of the MAP Program lies in the concept that student achievement is a local event. The issues of student achievement vary from student to student, class to class, grade to grade and school to school. The program provides a managerial instructional process to ascertain ways and means to diagnose instructional and curriculum issues and to establish processes that will increase student achievement. The MAP Program sees students, classes, teachers, subjects, curriculum and school administrative practices as an ever evolving interactive process that impacts student achievement.
The MAP program acknowledges the impact of district initiatives, especially in terms of curriculum.
To understand the MAP program, look at this conceptual model of the instructional process at a school.
|
The State of A school’s curriculum is based on these frameworks A teacher delivers this curriculum in an instructional environment (the class). A student takes the FCAT and can score between 1 and 5. |
FCAT Score |
||||||||
|
5 4 3 |
|||||||||
|
Frameworks |
► |
Curriculum |
► |
Teacher |
► |
Class |
► |
Student |
|
|
The question here is what does the FCAT Score of 1-5
really mean? |
2 1 |
||||||||
Based on the above conceptual model the FCAT score is a measure of the instructional chain. A score from 3-5 indicates the instructional chain has been successful. A score of 1 or 2 indicates the instructional chain has not been successful. From a practical point of view, how does an educator approach the non-successful instructional chain? Here are some possible questions to consider:
Does the student lack the innate ability to be successful or are there non-instructional concerns like personal or guidance issues inhibiting student performance?
Is the instructional environment (class) designed to succeed? Were student strengths and weaknesses considered in the scheduling process?
Does the teacher have mastery of the curriculum and are the proper aspects of the curriculum being emphasized? Could it be that the teacher has mastery of the curriculum but needs assistance with effective teaching techniques or would work better with certain categories of students?
Is the curriculum aligned and sequenced properly as measured by the FCAT?
The MAP program views the instructional process at a school at the Component level thus providing instructional staff the opportunity to determine the weak link(s) in the instructional chain and providing remedial courses of action.
MAP Process
The MAP Process is clear and concise. It has been designed to minimize the need for extensive training thus allowing educators the time to educate and focus on students’ needs. The MAP Manual is carefully organized to adapt to any size school. Each task has been carefully formulated and designed to meet the goal of increasing student achievement. Each task is accompanied by a summary report of data or the opportunity to utilize sophisticated, analytical tools for in-depth analysis. Redundancy has been removed from the process to increase efficiency of time and personnel resources. Tasks can be delegated based on the organizational structure of a school.
Actual Process
Select Task from MAP Manual
Generate summary report through the MAP Corridor
Place report in School MAP Profile
Review Interactive Analysis Option
Follow Educational Recommendations based on data
AIDE Overview
The ADS Academic Interpretation & Data Evaluation System (AIDE) empowers leadership and instructional staff with the data necessary to diagnose instructional and curriculum issues and establish methodologies to increase student achievement. Unlike most student diagnostic systems, the program does not assume only academic deficiencies on the part of the student. The AIDE program provides analysis at the student, class, teacher, subject, and school levels in a stand alone fashion or in relation to standardized testing. Data presentation is prescriptive, descriptive, and predictive.
Under the MAP Program access to the AIDE program is obtained
through the MAP Corridor. This interface
is designed to provide instant summary information. The entire MAP Program can be successfully
operated through this corridor. Mastery
of this module can be accomplished in a matter of minutes.
The AIDE Program is a Windows-based software program
designed to operate via Win 98 or later versions of Microsoft Windows. AIDE utilizes a very unique information
distribution system designed to operate in any environment. AIDE will operate successfully in a connected
(network) and/or non-connected (stand alone)environment. The AIDE information distribution system
acknowledges that not all school systems and schools have the same level of
connectivity; therefore, AIDE has various means to move data to interface within
the current technology operating parameters of a school system or school.
AIDE Special Features
AIDE Standard
In order to diagnose instructional and curriculum issues, student, teacher, and curriculum information must be measured against a standard. The FCAT utilizes a variable scoring system at the content area level. This explains why two students can receive the same Raw Total score but have two different scale and developmental scale scores. To assist educators and teachers in the data discovery process, the AIDE program looks at district data and establishes a district average or standard. The standard is essentially a benchmark which is determined based upon the following categories:
FCAT administration grade level
Level 3 SSS (
GPA achieved by level 3 students
Content scores achieved by level 3 students
The AIDE Program arrives at the standard through the following process:
Selection of all students who have an FCAT Score
Selection of FCAT Grade
Selection of all students who are SSS level 3
Average this sub group of student information in regards to GPA and content area scores.
Through this standard, content area curriculum and instructional issues can be assessed at the student, teacher, and subject area levels and remedial action can be initiated.
AIDE Variables
To assist educators, the AIDE program looks at students’ FCAT scores and determines their status in relation to the FCAT. This data enables educators to diagnose instructional and non-instructional issues that affect FCAT scores.
Bubble Student - A student will be identified in the Bubble
category if the SSS Reading and/or SSS Math Scale Score is
10 points below or above the FCAT level 3 cut score.
25 Percent - A student
will be identified in the 25 percent category if the SSS Reading and/or SSS
Math Developmental Scale Score falls in the lowest 25 percent of FCAT Grade in
which the student tested.
1 and 2 - A student will be identified in the 1, 2 category if the SSS Reading and/or SSS Math level is
1 or 2.
Loss - A student will be identified
in the Loss category if the student dropped one or more SSR or SSM levels.
Conflict - A conflict student has a grade point average (GPA) of 3.0 or higher but scored a level 1 or 2 on either the SSR or SSM.
AIDE Calculators
The AIDE Program implements a series of real-time
calculators that examine data to provide the user with numerical conclusions.
Min/Max Calculators – The AIDE program provides real-time calculations based on minimum score, average score, maximum score, and standard deviation for numerical calculations.
SSS and NCLB Calculators – These calculators allow the user to ask “what if” questions in relation to A+ and NCLB.
A+ and NCLB Emulators
The Emulators allow the
instructional and administrative staff to view a school as the State of
AIDE Filtering Techniques
The AIDE program provides a user-friendly filtering process to isolate learning communities based on students’ strengths and weaknesses.
Instant Identification of Safety Net Students
The AIDE program instantly identifies safety net students based on FCAT results and content area deficiencies.
Curriculum and Instructional Investigatory Tools
The AIDE program provides a series of tools to ascertain instructional and curriculum issues at the content area level. These tools allow administrative and instructional staff to track these issues back to individual subject and teachers.
Aide Color-Coding
The AIDE program makes extensive use of color-coding for quick identification of curriculum and instructional information. The basic rule is based on a traffic light system.
Red - stop and review the data.
Yellow - slow down there is reason for concern.
Green - all performance is satisfactory.
AIDE Help System
The AIDE Program has an extensive online help system including competency based tutorials.
Curriculum and Instruction
Academic Program Deficits
Student academic performance is a combination of innate ability, motivation, and educational opportunities. Curriculum and instructional issues directly impact student progress. The key to increased academic performance is twofold:
- Identification of curriculum and
instructional deficits which undermine student achievement.
- Development of a strategic plan for
their resolution.
The MAP program provides the user with the ability to analyze data strategically from both global and focused perspectives. This dual perspective empowers instructional leaders and staff with the specific data necessary to identify academic program deficits (both instructional gaps and curriculum gaps) and establish methodologies to increase student achievement.
Baseline student performance data is instantaneously presented by total score and individual content area strand performance. Concise graphs and reports categorize data by school-wide, subject area, teacher, and individual student performance. Since the data mining process is automated, data analysis is no longer laborious. As a result, instructional leaders are encouraged to look deeper. Academic deficits which had previously gone unnoticed soon become apparent. As a result time previously spent on data analysis can now be applied to designing specific strategies to close the gaps.
By reviewing data from both global and focused lenses, the instructional leader and staff can determine trends in student academic performance and identify weak areas. This identification process is crucial to increasing student learning gains. The guesswork in developing a strategic plan is eliminated because academic program deficits, both curricular and instructional, are clearly diagnosed through the use of data analysis.
Curriculum Gap Overview
A curriculum gap is
a more global problem that occurs when instruction and/or materials are not
aligned with the
- The content is not being taught at all.
- The content is not being taught in the correct sequence.
- The content is being taught with insufficient materials/strategies.
This misalignment can readily be seen using MAP because of the unique color-coding system and concise reports and charts. By following the steps clearly outlined in the tasks, the instructional leader(s) can first locate and study school-wide, subject area, and course gaps. then make informed decisions when building a strategic plan to improve academic performance.
Instructional Gap Overview
An instructional gap occurs when an individual instructor uses ineffective instructional strategies to teach the content, fails to teach the appropriate content, teaches the content out of sequence or uses inappropriate materials. An instructional gap can be identified when students’ performance in a particular teacher’s class(es) falls below the AIDE school standard. Student performance is categorized by total score and individual content area strand performance. Because an individual teacher’s student performance is compared with the school standard, subject area standard, and particular course standard, the instructional leader can identify areas where student performance is sub-standard. Then, specific strategies can be designed to assist the instructor in mastering more effective teaching techniques.
Instructional gaps should first be identified by using the benchmark assessment program incorporated in the AIDE software. After each benchmark is administered the user can compare and contrast the performance of each teacher’s class(es) with the school average. If the students’ progress in any class lags significantly behind the school average, then coaching strategies should be employed to assist the teacher in providing more effective instruction.
The MAP program also allows the user to further pinpoint instructional gaps during the summative phase. Each teacher’s class(es)’ performance on the current year FCAT can be easily compared with other teachers’ classes at the same grade level/content area. This provides the user with valuable information to begin proactive planning for the upcoming school year.
How Can I Use MAP data to find Curriculum and
Instructional Gaps?
Determining deficits is essentially a two-step process. The first step is identifying areas of sub-standard performance: those content area strands where students scored the lowest percentage of possible points correctly. The user identifies sub-standard performance by completing the MAP tasks. The tasks are sequentially organized to move from school-wide (global) analysis to focused (individual teacher) analysis. This process is simplified by the unique color-coding system. The second step involves asking provided questions to analyze identified deficits and following Educational Recommendations to resolve both curriculum and instructional gaps.
Identifying Curriculum Gaps is a matter of reviewing specific screens and reports and asking pointed questions regarding the data. This analysis can be best accomplished through cooperative analysis since each reviewer brings a “separate lens” and expertise that will deepen the analysis. The instructional leader and Leadership Team should utilize the MAP reports in conjunction with the Curriculum and Instructional Gaps Planning Guide to get a complete picture of student performance deficits.
The user can
identify Instructional Gaps by using the tasks designed to analyze
benchmark performance and those which provide a comparison between class
performance at the same grade or within the subject area. Teachers can also do
more effective self-assessment because they have student performance data at
their finger tips.
MAP makes data analysis simple. As a result, more time can be devoted to the crucial step of strategic planning: determining the cause(s) of the deficit and finally creating specific strategies to correct the problem. As a result, each school can maximize student performance and potential.
Curriculum
and Instruction Questions
Curriculum
- Is this deficit unique to our school or
is it a state and/or district gap?
- Is this deficit a school-wide problem?
- Are there patterns across grade levels
showing a consistent deficit in a particular sub-strand?
- Were the materials taught in the correct
sequence?
- Were departmental strategies effective
and consistent?
- Did the materials used cover the content
adequately?
- Which grade level has highest % of level
1’s and 2’s?
Instructional
- Is this deficit a content area/grade
level deficit?
- Do any one teacher’s students surpass or
lag behind the others?
- Is this deficit a result of inadequate
materials or poor sequencing?
- Is this deficit a result of the teacher
using ineffective instructional strategies?
- Are teachers with higher performing
students sharing instructional and motivational strategies?
- Have I considered the original make-up
of the teacher’s class when interpreting student performance?
NCLB
- Can I discern a performance pattern by
ethnicity?
- Can I see a pattern by socio-economic
status?
- Can I see a pattern for students with
disabilities?
- Do individual teacher biases in any way
contribute to this deficit?
- Are standards consistent for all
ethnicities /socio economic status?
Scheduling
Effective scheduling is crucial to maximizing student academic potential and taking full advantage of the educational resources available. Through the use of the MAP program, an instructional leader can be both diagnostic and prescriptive in creating a course master. Given the data available, placing students in the appropriate class or courses is no longer a random act, but a series of strategic, calculated events.
The purpose of the MAP Scheduling section is to guide the user through a series of data gathering tasks which facilitate the user’s thought process in determining the best placement for students and teachers. MAP Scheduling Tasks initially introduce the user to a wide overview of the school’s biographical and academic demographic. Each task narrows the user’s view of data, highlighting the school’s particular needs. Each report within the task dissects and sub-divides student data based on FCAT strands and NCLB criterion. This information provides a platform from which to build a truly effective instructional environment. The tasks compel the user to thoroughly examine three key scheduling elements: the schedule format, student needs, and effective teacher placement. The fourth element, allocating resources, will be directed by the meticulous configuration of the other three.
Scheduling Questions
- What scheduling format is our school
committed to?
- Are there any unique features to our
scheduling format that may affect student performance? How?
- Can students within the various NCLB
categories be identified?
- Have students with special needs been
identified?
- Are there groups of students that need
to be scheduled together to help meet their educational needs?
- Are there groups of students that need
to be scheduled separately to help meet their educational needs?
- Are there school-wide, grade level or
departmental concerns that need to be addressed?
- Are there scheduling patterns across
grade levels that need to be addressed?
- Have the appropriate number of courses
been created to support the scheduling format, course alignment, and the
number of students?
- What supplemental courses are needed to
address student needs?
- Have additional resources been allocated
for the additional needs?
- Looking at the teachers’ prior strengths
and weaknesses, have the teachers been assigned properly?
- Have allowances been made for the high
achieving students as well as low achieving students?
Safety Net Overview
Safety Nets are programs or activities offered for the purpose of improving student academic performance. They can be divided into two categories: internal Safety Nets and external Safety Nets. Internal Safety Nets are activities designed by the classroom teacher. The teacher generates activities to address, assess, and remediate skills. In an effort to build capacity in student learning, Safety Nets can also be external. External Safety Nets serve the same purpose as internal Safety Nets; however, they are generally offered in the form of a formalized school-wide program. One of the keys to successful Safety Net programs and/or activities is to be able to target the area of concern and begin to address the area instructionally. The MAP program allows the opportunity to assess school level and class level Safety Net needs.
Through the use of the MAP program, an instructional leader can be both diagnostic and prescriptive in providing accurate information for internal and external Safety Net programs. The Safety Net tasks provided in MAP allow the user to analyze data quickly and effectively at all levels: school, grade, content area, instructor ,and individual student based upon FCAT content area strand performance. As a result, the specific data necessary to strategically determine effective Safety Net instruction at the school, grade and most critically, class levels is at the user’s fingertips.
The Safety Net tasks offer specific educational recommendations to make school Safety Net offerings the most effective in maximizing student academic potential and performance. Since areas of deficit are clearly identified by content area strand data, the instructional staff can customize strategies to overcome curriculum gaps and address students’ individualized needs. Time, no longer wasted on data mining, can now be spent in crucial discussion of deficits and strategic planning for their resolution.
Through this process the instructional leader and staff have true insight and can determine the types of strategies and assessments needed to improve and sustain high academic performance. The administration, Leadership Team, instructional staff, and parents can focus on designing strategies and allocating resources so that all children have an opportunity to maximize their learning potential. A list of analysis questions is provided to assist the Leadership Team in task completion and the development of a truly effective Safety Net program.
Safety Net Questions
- Where are the areas of deficit in our
school?
- Is this deficit unique to our school or
is it a state and/or district deficit?
- Are there patterns across grade levels
showing a consistent deficit in a particular sub-strand?
- What Safety Net opportunities are
available to address individual strands?
- What supplemental or resource materials
are needed to address the individual strands?
- What type of assessment tools will be
used to monitor effectiveness of Safety Net programs?
- Would school-wide or departmental
strategies be an effective approach for addressing the school’s greatest
deficit?
- Does any one teacher’s data surpass or
lag behind the others?
- Which areas are the higher performing
students showing as deficits?
- Do all students have the same access to
Safety Net Programs?
- Are the identified students
participating?
- Do individual teacher biases in any way
contribute to this deficit?
- Are standards consistent for all
ethnicities /socio economic status?
Due to NCLB and the A+ Plan for Education, school accountability is becoming an increasing requirement and focus at both the state and national levels. Educators have always been accountable to their stake-holders: the students, parents, district, and community at large. The level of accountability has dramatically increased and measurement tools have become more sophisticated. Schools must not only be in the business of providing quality education to their students, but they must also be able to qualify that process based upon state and national performance standards.
The MAP program provides the user with the tools to analyze performance data and establish accountability at every level: school-wide, grade level, subject area, teacher, and individual student. By completing a series of structured and sequential tasks, the user has all the data necessary to thoroughly assess academic performance, curriculum alignment, instructional effectiveness, and the quality of Safety Net programs offered to maximize student achievement. By distributing data and involving the Leadership Team and instructional staff in data interpretation and strategic planning, everyone takes an active role in building the most effective, instructional program. The School Improvement Planning process becomes an ongoing, vital process involving ongoing assessment and strategy revision.
The accountability process is ongoing and cyclical. Pre-school, pre-planning, quarterly, and summative activities are provided to ensure that every aspect of the instructional process is thoroughly investigated. By completing the MAP tasks sequentially and following the Educational Recommendations, any school can evolve into a true learning community where education is a collaborative process maximizing student achievement. Comprehensive reports and color-coded visuals allow the user, Leadership Team, instructional staff, students, and parents to take an active role in the learning process via self-assessment, strategic planning, and suggested activities.
MAP Tasks
MAP Tasks are located in this MAP Manual and in the MAP Corridor. The manual and corridor interface with each other. The program recommends the user progress though a task as follows:
MAP Corridor
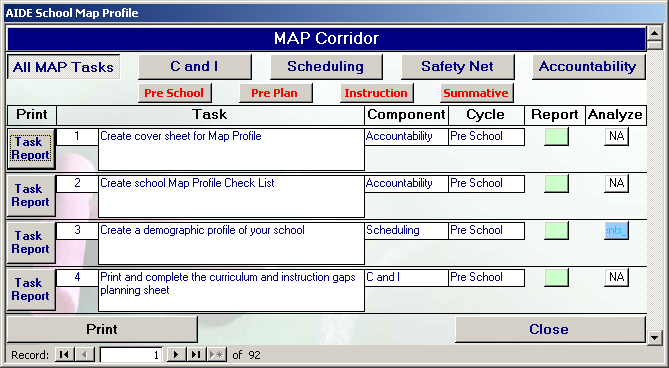
Map Task Work Flow
Select Task
▼
Print Task Report
▼
Print Summary
Report if available – Green Box under Report
▼
Use Interactive
Option, if desired – Blue Box under Analyze*
▼
Insert Task and
Summary Report in School MAP Profile
▼
Follow Educational
Recommendations when applicable
▼
Document
actions/steps on task report
▼
Check off task on
MAP Profile Check List when complete
*Option:
The user can select the Analyze function on the MAP Corridor to investigate and analyze the TASK data (The Blue Box under Analyze). Some tasks have multiple reports depending on school type or instructional cycle. The user accesses these reports through the blue Analyze button.
Appendix - AIDE Menus
Menu 1
MAP – Managing Academic Progress – A year long instructional time line that lists both administrative and instructional activities and actions to be performed by principals, administrators, guidance staff, teachers, students and parents to maximize student performance.
AIDE Express – Wizard-based report system that answers the ten, data analysis questions most frequently asked in AIDE. The wizard has a math and a reading section.
First AIDE – A comprehensive, interactive, data analysis system that views the complete instructional process in a school. Performance trends are easily identified.
Menu 2 - AIDE Express
AIDE Reading Wizard – A wizard-based reporting system that answers the ten most important instructional questions in regard to FCAT Reading.
AIDE Math Wizard – A wizard-based reporting system that answers the ten most important instructional questions in regard to FCAT Math.
Menu 3 - AIDE
Analysis – This panel allows the user to view and analyze the complete instructional process at a school at every level: student, class, teacher, subject, course, benchmarks, FCAT gains and losses.
Prescription
Panels – This panel allows a school to view
performance as the State of
Safety Net – This panel provides an executive overview of a school from a FCAT point of view, identifies Safety Net students, and provides an investigatory tool to ascertain curriculum and instructional gaps.
School User Panels – This panel allows a school to maintain its own data sets, export data in a variety of ways, and perform statistical analysis.
AIDE Report System – This panel offers a comprehensive list of reports designed to provide all staff with the information necessary to increase student achievement.
Setup – This panel provides avenues for data import and governance of screen resolution.
Menu 4 - Analysis
Student Analysis – This section allows the user to view individual student data compared to the AIDE school standard or analyze student body demographics.
Class Analysis - This section allows the user to view and analyze individual class performance compared to the school AIDE standard and print reports.
Teacher Analysis - This section allows the user to view and analyze individual teacher data based upon student performance and to generate color-coded graphs.
Subject Analysis - This section allows the user to view and analyze subject data based upon student performance and to generate color-coded graphs.
Course Analysis – This section allows the user to view and analyze student performance, grade data and FCAT scores by courses and to generate color-coded graphs.
Benchmarks – This section provides data on benchmark testing at the student and course levels.
FCAT Gains/Losses – This section allows the user to view and analyze gain/loss data on the FCAT and NRT from a raw point of view, A+, and NCLB point of view.
Menu 5 - Student Analysis
Student
Profile – This
unique profile provides student biographical data, schedule, grades,
attendance, tardies, Sunshine State Standards and
Norm Referenced Test Data. Also in this section are comparison graphs of the
student to the school and district Sunshine State Standards in
Student Body Analysis – This panel provides an overview of the student body in terms of biographical data. The panel employs the AIDE filtering processes to establish groups of students based on user defined criteria.
SSR
Analysis – This panel provides both a text and
graphical overview of the student's Sunshine State Standards Reading Scores in
relation to school and district standards.
SSM Analysis – This panel provides both a text and graphical overview of the student's Sunshine State Standards Reading Scores in relation to school and district standards.
Menu 6 - Class Analysis
Class
Profile - This panel provides an overview of an individual
class. The Student Bio Section includes a demographic profile of a class.
The Courses section includes class GPA, total attendance and tardies. The SSS Section is a complete overview of
the Sunshine State Standards test data including math and reading sub scores.
This section combines all the students enrolled in the class and averages
their scores. The AIDE Variables indicate the total number of students in
these categories. The SSR Synopsis section indicates the class’s standing
in comparison to the AIDE standard for GPA and SSR content scores. The
SSM Synopsis indicates the class’s standing in comparison to the AIDE standard
for GPA and SSM content scores. A Class Profile and Class Instructional
Plan (CIP) are available from this panel.
Menu 7 - Teacher Analysis
Teacher
Profile - This panel provides an overview for an
individual teacher. The Student Bio section includes a demographic
profile for each teacher’s total enrollment. The course section includes
class GPA, and total attendance and tardies by
subject. The SSS Section is a complete overview of the Sunshine State
Standards test data including math and reading content scores. This
section combines all the students a teacher has and averages the scores.
The AIDE Variables indicate the total number of students in these
categories. The SSR Synopsis section indicates the teacher’s standing in
comparison to the AIDE standard for GPA and SSR content scores by subject and
FCAT Grade. The SSM Synopsis indicates the teacher’s standing in
comparison to the AIDE standard for GPA and SSM content scores by subject and
FCAT Grade. A teacher profile and Teacher Instructional Plan (TIP) are
available from this panel.
Teacher Grades – This panel provides a view of each teacher and the number and percentage of grades issued by quarter.
Teacher
SSR
Teacher SSM Math Synopsis – This panel provides an overview of every teacher by subject and FCAT administration grade in comparison to the AIDE standard. Also presented is student population, ESE population, ESOL students, and AIDE variables.
Teacher Analysis – This panel provides a graphical overview of a teacher including SSR and SSM scores, content areas, gains/losses, grades, and SSR/SSM scores in comparison to FCAT results.
Menu 8 - Subject Analysis
Subject
Profile - This panel provides an overview for an
individual subject. The Student Bio Section includes a demographic
profile for total enrollment by subject. The course section includes class GPA,
total attendance and tardies by subject. The
SSS Section is a complete overview of the Sunshine State Standards test data
including math and reading content scores. This section combines all
enrolled students and averages the scores by subject. The AIDE Variables
indicate the total number of students in these categories. The SSR
Synopsis section indicates the subject’s standing in comparison to the AIDE
standard for GPA and SSR content scores by subject and FCAT administration
grade. The SSM Synopsis indicates the subject’s standing in comparison to
the AIDE standard for GPA and SSM content scores by subject and FCAT
administration grade. A Subject Profile and Subject Instructional Plan
(SIP) are available from this panel.
Subject Grades – This panel provides a view of each teacher and the number and percentage of grades issues by quarter.
Subject
SSR
Subject SSM Math Synopsis – This panel provides an overview of every subject and FCAT administration grade in comparison to the AIDE standard. Also presented is student population, ESE population, ESOL students and AIDE variables.
Subject Analysis – This section provides a graphical overview of a Subject including SSR and SSM scores, content areas, gains/losses, grades and SSR/SSM scores in comparison to FCAT results.
Menu 9 - Course Analysis
Quarter
Grade Analysis – This panel provides an overview of all
students sorted by class and teacher and the students’ grades, bio data and
SSR Content Scores, Courses and Students - This panel provides an overview of all students sorted by class and teacher and the students’ grades, bio data, SSR Levels and Content scores and Reading AIDE Variables.
NRT Reading Content Scores, Courses and Students - This panel provides an overview of all students sorted by class and teacher and the students’ grades, bio data, NRT Percentile and Content scores and Reading AIDE Variables.
SSM Content Scores, Courses and Students - This panel provides an overview of all students sorted by class and teacher and the students’ grades, bio data, SSM Levels and Content scores and Math AIDE Variables.
NRT Math Content Scores, Courses and Students - This panel provides an overview of all students sorted by class and teacher and the students’ grades, bio data, NRT Percentile and Content scores and Math AIDE Variables.
Menu 10 - Benchmarks
Reading
Benchmarks – This panel provides initial SSR content
scores and up to three benchmark scores per content area, bio data and reading
AIDE Variables. This panel offers all students, FCAT eligible students, SSR
3, 4 and 5, SSR 1 and 2 and the lowest 25%.
Math Benchmarks – This panel provides initial SSM content scores and up to three bench mark scores per content area, bio data and reading AIDE Variables. This panel offers all students, FCAT eligible students, SSM 3, 4 and 5, SSM 1 and 2 and the lowest 25%.
Reading Benchmarks by Courses and Students - This panel provides initial SSR content scores and up to three benchmark scores per content area, bio data and reading AIDE Variables by student, class and teacher.
Math Benchmarks by Courses and Students - This panel provides initial SSM content scores and up to three benchmark scores per content area, bio data and reading AIDE Variables by student, class and teacher.
Menu 11 - FCAT Gains and Losses
FCAT
SSR
FCAT
SSR
FCAT SSM Math Gains/Loses A+ - This panel indicates Gains/losses by SSM Level, SSM Developmental Score and SSM Scale Score. Students can be selected by All Students, FCAT Eligible, SSM 3, 4 and 5, SSM 1 and 2, students who have increased at least 1 FCAT level, Level 1 or 2 students who have a grade level increase, students counted in the lowest 25% and those 25% students with a grade level increase.
FCAT SSM Math Gains/Loses NCLB - This panel indicates Gains/Losses by SSM Level, SSM Developmental Score and SSM Scale Score by NCLB criteria.
FCAT
FCAT Math Gains – This panel indicates raw gains and losses by SSM Level, SSM Developmental, SSM Scale, NRM Percentile and NNM Scale scores.
Menu 12 - Prescription Panels
FCAT
Analysis A+ - This panel provides an overview of a
school’s population, FCAT Writing,
FCAT
Analysis NCLB - This panel provides an overview of a
school’s population, FCAT Writing,
FCAT SSR Reading Content Scores A+ - This panel provides an overview of school population SSR level, Scale and Developmental scores. Also included are the reading content scores in raw number and converted to percentages. The NRR percentile is included for cross referencing. Student selections are All students, FCAT Eligible, FCAT 3,4,5, FCAT 1,2 and Lowest 25%. Student bio data and AIDE Reading variables are also available. A Potential SSR Calculator is available to answer “what if” questions.
FCAT
SSR
FCAT
NRT
FCAT SSM Math Content Scores A+ - This panel provides an overview of school population’s SSM level, Scale and Developmental scores. Also included are the mathematics scores in raw number and converted to percentages. The NRM percentile is included for cross referencing. Student selections are All students, FCAT Eligible, FCAT 3,4,5, FCAT 1,2 and Lowest 25%. Student bio data and AIDE Math variables are also available. A Potential SSM Calculator is available to answer “what if” questions.
FCAT SSR Math Content Scores NCLB - This panel provides an overview of school population’s SSM level, Scale and Developmental scores. Also included are the mathematics content scores in raw number and converted to percentages. The NRM percentile is included for cross referencing. Student selections are NCLB Compliant. Student bio data and AIDE Math variables are also available. A Potential AYP Calculator is available to answer “what if” questions.
FCAT NRT Math Content Scores – This panel provides an overview of a school population’s NRT Percentile and NRT content scores cross referenced with SSM Level. Student bio data and AIDE Math variables are also available
Menu 13 - Safety Net
FCAT SSR Reading Content Scores Safety Net – Students – This panel identifies students by SSR level and scale score in need of reading remediation and details content scores in relation to the AIDE standard. Bio and AIDE Variable data is also available.
FCAT SSR Reading Content Scores Safety Net - C and I – This panel is an investigative tool to ascertain curriculum and instructional gaps in relation to the AIDE Standard. Students are measured based on content scores regardless of SSR Levels. Bio and AIDE Variable data are also available.
FCAT SSR Executive Summary – This panel provides a single page overview of a school’s population from an FCAT reading point of view.
FCAT SSM Math Content Scores Safety Net – Students – This panel identifies students by SSM level and scale score in need of mathematics remediation and details content scores in relation to the AIDE standard. Bio and AIDE Variable data is also available.
FCAT SSM Math Content Scores Safety Net - C and I – This panel is an investigative tool to ascertain curriculum and instructional gaps in relation to the AIDE Standard. Students are measured based on content scores regardless of SSM Levels. Bio and AIDE Variable data are also available.
FCAT SSM Executive Summary – This panel provides a single page overview of a school’s population from an FCAT math point of view.
Menu 14 - School User Panels
School User Panel – This panel allows a school to maintain their own data sets.
District Information – This panel allows the district to distribute custom information to a school.
Progress Report Text – This panel allows custom messages on Student Progress reports.
Profile Report Text – This panel allows custom messages for mailable student profiles.
Export Panel – This panel allows export of data for alternate uses.